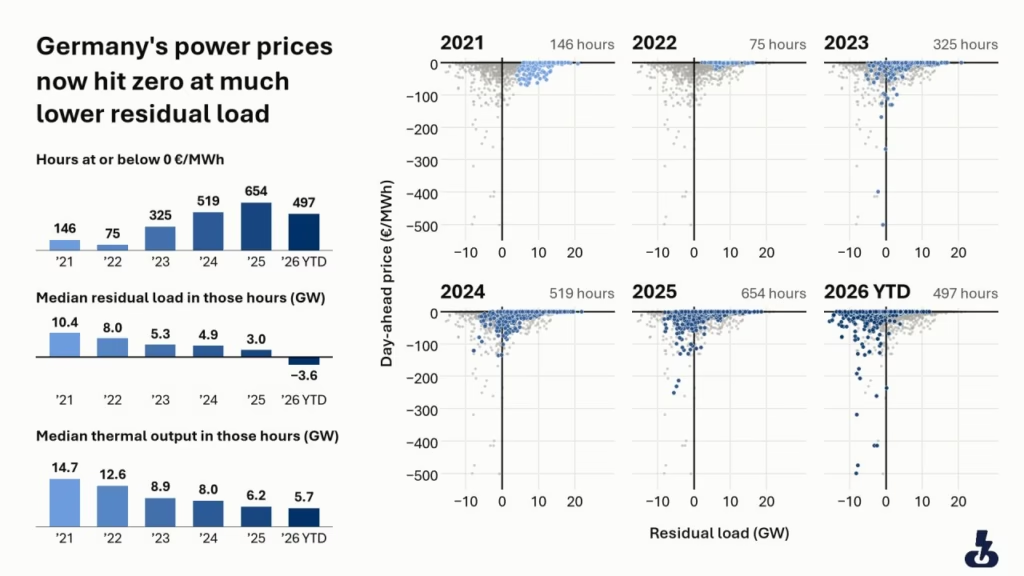
The chart shows every hour since 2021 when the German day-ahead power price was at or below €0/MWh.
Each panel represents one year. Residual load — electricity demand minus wind and solar generation — is shown on the x-axis, while day-ahead spot prices are on the y-axis. The grey dots show the other years for comparison.
Three things stand out.
Zero and Negative Prices Are Becoming More Common
Zero and negative power prices have become far more common as intermittent renewable generation has increased.
Germany recorded 146 hours with prices at or below zero in 2021. That increased to 654 hours in 2025, while 2026 is already at 497 hours.
Germany Can Absorb More Renewable Oversupply Before Prices Collapse
Zero and negative prices now occur at much lower residual load levels.
In 2021, 81% of hours with 5–10 GW of residual load were priced at or below zero. In 2025, that share was 40%, and so far in 2026 it is just 7%.
Part of the trend is simply that Germany now has more hours with oversupply from solar generation.
But the power system can also absorb much more renewable production before prices collapse, through exports, storage and flexible electricity demand.
There Is Less Thermal Must-Run Generation
There is also less thermal must-run generation in the German power mix.
In 2021, around 15 GW of nuclear, lignite, coal and gas generation was still running during a typical zero-price hour.
By 2025, that had fallen to around 6 GW, with nuclear generation gone since April 2023 and coal and lignite running less.
With less inflexible generation that has to keep producing, residual load can fall much further before the market becomes oversupplied.
When Do Germany’s Deepest Negative Prices Occur?
The deepest negative-price hours, reaching as low as −€500/MWh, are concentrated within a relatively narrow window: spring and early-summer middays.
Every one of these hours occurred on a weekend or public holiday.
During these periods, solar generation is close to its annual peak while electricity consumption is among the lowest of the year — around 43 GW compared with approximately 58 GW during a typical spring midday.
A large share of Germany’s solar capacity consists of small rooftop installations that do not respond directly to wholesale price signals. Generation therefore continues even when wholesale prices become deeply negative.
Comparing Prices Across the Years
Since the German day-ahead market moved to 15-minute products in October 2025, we use the hourly average of the four quarter-hour prices.
This allows all years to be compared on the same hourly basis.
Historical data: ENTSO-E.