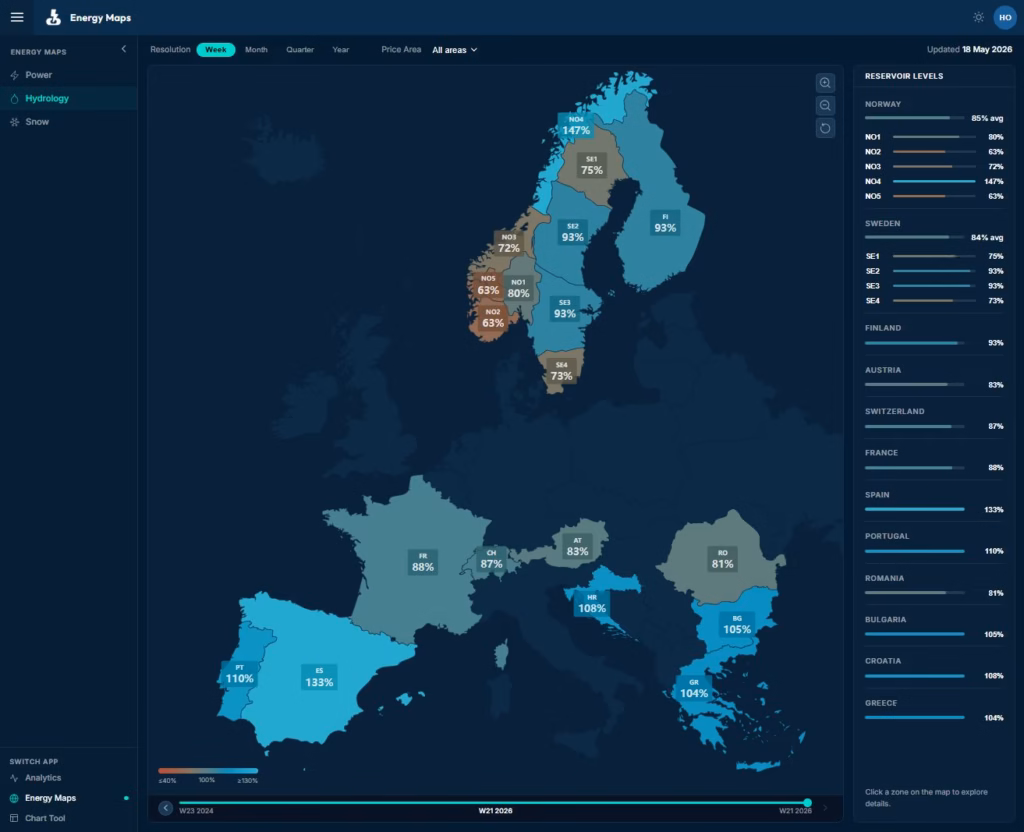
At Volt Power Analytics, we’ve been building Energy Maps to make it easier to get a clear overview of European energy. Here’s what we see when we zoom in on hydro reservoirs this week.
🌊 Norway
NO4 is at 147% of normal reservoir filling, and spot prices reflect it, averaging around €9/MWh this week.
NO5 is at 63% of normal and has been the most expensive Norwegian price zone for most of the spring.
The spread between north and south reached €73/MWh this week, driven by different hydrological conditions and grid congestion.
☀️ Iberia
Reservoir levels in Spain reached an all-time high in May 2025 (15,495 GWh) and are currently very close to the same level at 15,429 GWh, equivalent to 133% of normal.
Portugal tells a similar story, currently sitting at 110% of normal levels, although levels have declined slightly since the peak in February.
The record-high reservoir levels are the result of severe weather, flooding, and heavy rainfall across Iberia over the last several years.
The water is there. But with limited interconnection capacity across the Pyrenees, much of the surplus remains within Iberia.
🏔️ Alps
Switzerland and Austria, the pumped hydro backbone of European grid balancing, are both below normal at 87% and 83% respectively.
Switzerland spent much of the winter above normal, but that has now reversed, just as the snowmelt season should be replenishing reservoirs.
These reservoirs play a critical role in balancing the Central European power system, and they are heading into summer undercharged.
🗺️ Southeast Europe
There is a surplus across much of Southeast Europe, while Romania sits at 81% of normal.
The region’s storage base is too small to move pan-European prices, but it remains important for regional market dynamics.
Looking Ahead
Strong solar generation is currently suppressing prices and masking much of the hydro signal.
But today’s reservoir map offers an early indication of what could matter later in autumn and winter, when solar production fades, heating demand rises, and wind becomes the key balancing factor.
That is when the Alpine deficit and Southern Norway’s dryness are likely to be priced in most sharply, particularly if a wind drought coincides with a period of high demand.
Stay tuned — Energy Maps is launching soon, with additional countries and functionality. Reach out if you’d like to learn more.